Google Sheets is a handy tool for tabulating and working on data, especially since it's cross-platform and free to use. While it doesn't yet match the functionality of Microsoft Excel, it has been consistently picking up new features every month — from deduplication and trimming of whitespace to enhanced formatting tools. Today, the Sheets team announced three new data reporting tools that can help get you closer to a dashboard running only on Google Sheets.
What's New?
Slicers

When shopping online, do you remember the checkboxes on the side that help you filter out unwanted products? Slicers let you do something similar for your reports — you can easily filter on a field and see all your charts and tables dynamically update. Pivot Tables (already present on Sheets) become a lot more effective when you can slice and dice them with Slicers.
Scorecard Charts
Scorecard Charts let you key in on a few metrics and compare performance visually. Previously, you would have to use a paid add-on to achieve this on Sheets, so it's a welcome addition.
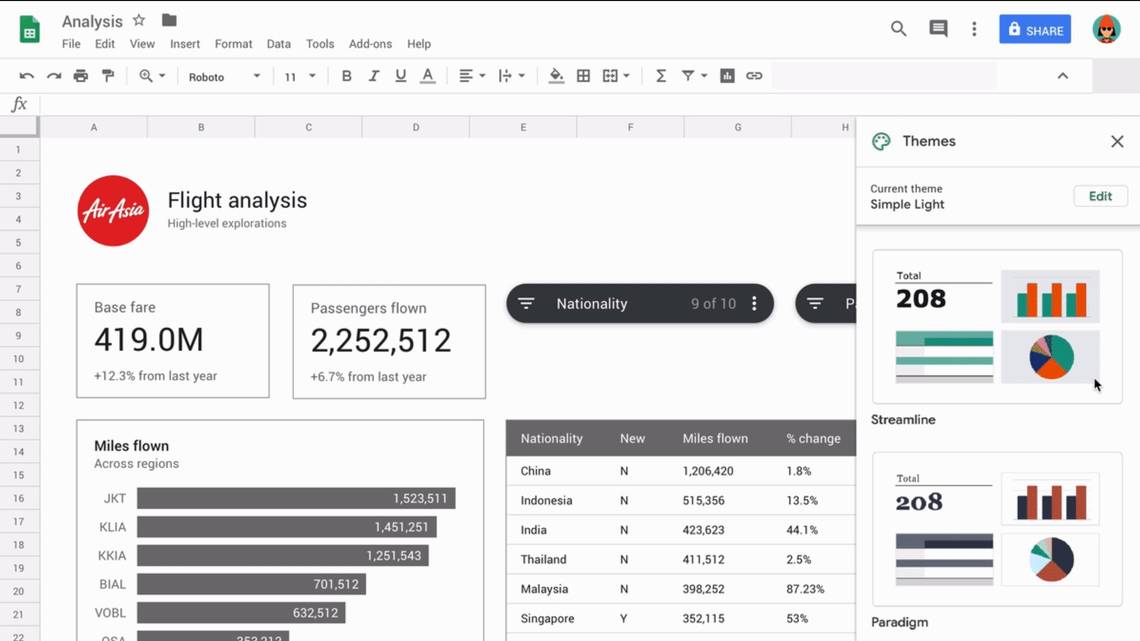
Themes
Support for themes is always handy, and Google Sheets can now give your charts a consistent tinge of color.
The update begins rolling out from today, so you should expect to see it in your Google Sheets interface in the not-too-distant future.
Source: Google