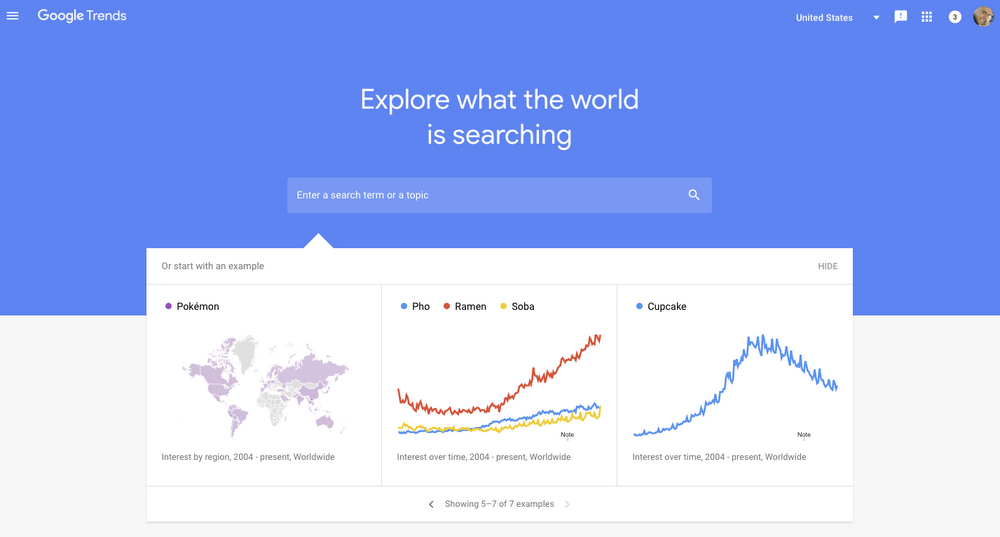
When people want to look something up, they will more often than not turn to Google. That means Google's search data becomes a snapshot of what's hot, and Google Trends gives you a window into it all. Today, the Trends site has gotten an overhaul with some new real-time data features, as well as curated content and new ways to visualize data.
Google's blog post included a handy bullet list of what's changed. Here you go.
- A revamped Trending searches section, showing what is trending in search right now, both daily and minute-by-minute.
- A newly-designed section where you can see Google Trends data stories curated by the News Lab team on everything from the Trump Administration through Mother’s Day. It’s also a great place to find amazing examples of Google data visualizations by newsroom designers from all over the world.
- Easy access to Year in Search data going back to 2001, so you can see how search interest has changed over time.
- New infographic types such as an intensity map to compare different topics in more meaningful ways.
The real-time data is probably the most impressive part of the redesign. You can access that in the Trending Searches section. Just make sure you click over to real-time instead of the daily trend. You can click on any item in the list to get search data over time. If it's not the current but the past that interests you, the home page has quick access to Google's Year in Search reports from 2001 to 2017.
The News Lab content is available from the home page. I'm not sure how much of this Google will churn out, but so far you can check out some of Google's new infographics with trends on gun control, the royal wedding, and more. The new site is live for everyone, so go check it out.
Source: Google