In one more slice of I/O developer news, Google has launched another set of tools for developers using its Console Dashboard for apps on Google Play. The new tool automatically analyzes app reports to show developers pertinent info about app issues. This is the 2nd big feature about making app performance and bug fixing easier for developers after the new visual profiler tools in the latest preview of Android Studio.
Just last month Google updated the developer console to material design. Between that and the announcements today, it's clear that Google wants to try to make things easier for developers. The new tool is part of the developer console for apps published via Google Play, and shows 6 top issues within a category of problems like ANR Rate, Crash Rate, Slow Rendering, etc. Within each issue it also tells you how many users are affected, and offers useful advice on how to fix it.
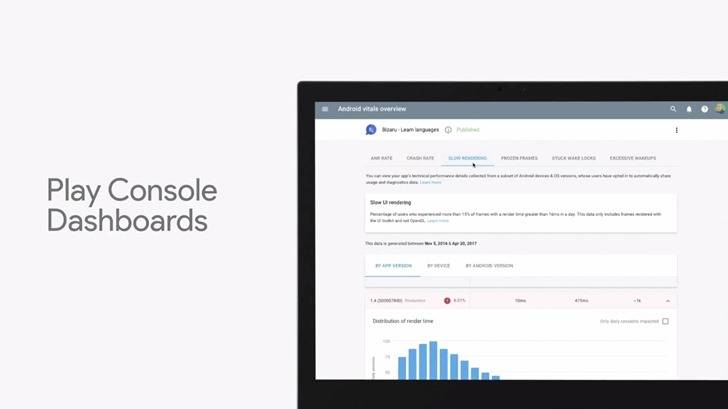
You can check out the help page for the new feature here if you are interested in more precise info, like descriptions of the different categories of data it presents or instructions, but it's pretty simple to use. After selecting your app in the dashboard you can see the new tools on the left in Android Vitals - Overview. If your app has any relevant data collected, it should be there. Between this and the new visual profiler tools announced, Android developers might have a slightly easier time pinpointing the source of problems and finding solutions.